Over the past few weeks, I’ve been diving deep into the fascinating world of graphs—especially as they relate to the rise of Data Object Graphs (DOGs).
What started as a few posts about how we use DOGs at Dataception quickly turned into a broader conversation about graph theory, knowledge graphs, execution graphs, and hybrid structures. The feedback has been brilliant—and a common request has been for a single, structured overview. So here it is: a practical summary of the different types of graph structures that power today’s most advanced data systems.
This post shares the high-level narrative I’ve built out across a series of LinkedIn updates and slide posts. I’ll also be doing a video deep dive soon—especially covering the connection between AI, Agents, and graphs—for the Data Product Workshop channel.
Let’s walk through the series.
🧱 Graph Foundations
At the most fundamental level, a graph is a set of nodes (vertices) and edges (connections). This deceptively simple structure underpins everything from social networks to search engines, and is a natural fit for representing how things connect in the real world.
But from that foundation, graphs quickly branch into specializations.
🕸️ Data Graphs
These graphs focus on representing relationships between data entities. Nodes carry data, and edges define how those nodes relate.
Examples include:
Social networks (e.g. LinkedIn connections)
Road and transport maps
Citation networks
Knowledge Graphs (semantically rich relationships between concepts)
Within this group, Knowledge Graphs are especially notable. They model not just that things are connected, but how and why they connect—through semantic triples and ontologies. Think:
Alice → works at → London Hospital
A triple of subject, predicate, object that gives machines reasoning capabilities, not just lookups.
⚙️ Execution Graphs
Unlike data graphs, execution graphs aren’t about relationships—they’re about computation.
They model how operations should run, in what order, and what depends on what. Each node is a function or operation; edges represent data dependencies or execution flow.
Common examples:
SQL execution plans
Machine learning models (e.g. PyTorch/TensorFlow)
DAGs in Spark or Airflow pipelines
These graphs optimize for performance, resource allocation, and execution sequencing—not discovery.
🔄 Hybrid Graphs
Here’s where things get exciting. Hybrid graphs combine data representation with execution logic. They can both model relationships and activate processes.
Enter: Data Object Graphs (DOGs).
🐕 Data Object Graphs (DOGs)
A DOG isn’t just a graph with information—it’s a graph with behavior.
Some nodes represent data (e.g. a financial instrument or healthcare record)
Others are executable (e.g. pricing a swap, updating a forecast)
Edges define not just relationships but how data triggers computation
This enables dynamic, AI-powered systems that can respond in real time. For example, in a financial risk engine:
A change in a Quote node triggers a recalculation of a Curve
That update cascades to reprice related Swaps
All provenance, impact, and results are traceable
It’s a living model, not a static one.
🔍 DOG vs. Knowledge Graph
A common question: “Aren’t DOGs just a type of knowledge graph?”
Not quite.
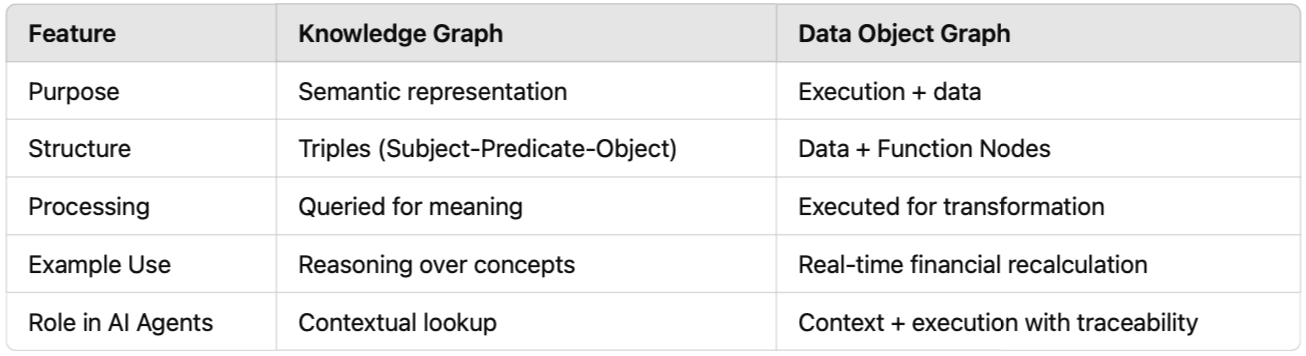
DOGs do what knowledge graphs represent.
🧭 Process Data Modeling
DOGs also introduce a new approach to modeling business systems: Process Data Modeling.
Rather than organizing data around static schemas, this models the actual business process flow, with:
Domain-specific data products
Embedded execution
Clear connections between states and transitions
The result is a graph-based, composable architecture where AI agents can operate contextually, reliably, and transparently.
Exploring the Wonderful World of Graphs
🚂 Where It’s All Headed
As systems get more complex and AI more pervasive, the ability to model data + logic + process in one unified framework becomes essential.
Graphs are no longer just about visualizing networks. They’re becoming the operational backbone for modern business systems.
And with Data Object Graphs, we’re not just talking about describing the world—we’re building systems that respond to it.
With Dataception Ltd’s DOGs, graphs are just a walk in the park. 🐾