What if you could talk to your investment portfolio—ask complex questions in plain English and instantly get nuanced, actionable answers?
At Dataception Ltd, we're making that a reality.
We're combining AI with Data Object Graphs (DOGs) to create a fundamentally new way of performing investment analysis—one that's dynamic, intuitive, and powerful enough to support the demands of today’s asset managers.
From Class Models to Data Object Graphs
Traditionally, portfolios have been modelled using flat tables, static objects, or at best, traditional knowledge graphs. These approaches struggle to capture the living, breathing nature of modern investment ecosystems.
So we reimagined the portfolio—not as a dataset, but as a graph of interconnected entities with built-in behaviour.
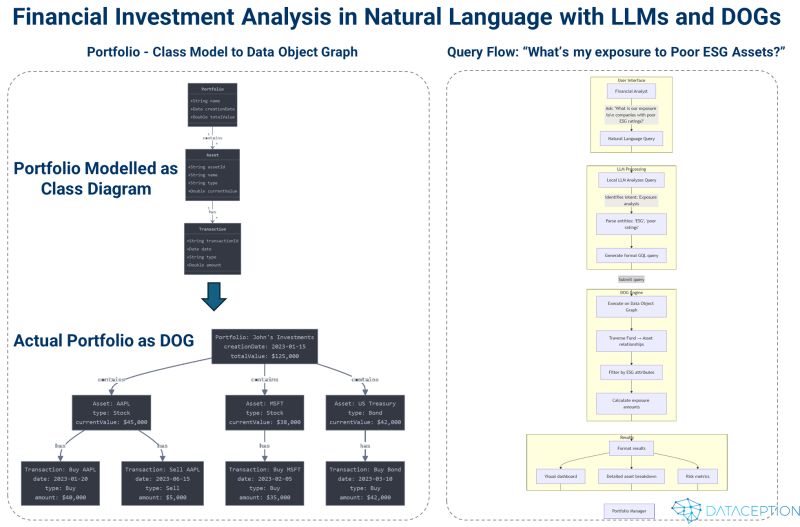
We started with:
A class model: portfolios, assets, transactions—complete with operations as methods (like pricing algorithms, ESG scoring, risk models)
Then instantiated it with real-world data: for example, John’s portfolio with Apple shares and renewable energy bonds
The result is a Data Object Graph (DOG)—a hybrid graph where:
Nodes represent both data and executable logic
Relationships are first-class citizens
Traversals dynamically execute operations along the way
This allows us to simulate and interrogate real-world scenarios—not just describe them.
Ask Questions in Plain English
The real breakthrough came when we connected a small, local LLM (language model) to the DOG—enabling natural language queries to be translated into graph queries using GQL, the graph query language standard.
Some real-world examples:
🟢 "What is our exposure to oil & gas companies?"
→ The LLM translates the question
→ The graph executes a traversal, with nodes calculating exposure as we go
→ Result: 3.4% exposure across 7 positions
🟢 "Show all investments with AAA ESG ratings in renewable energy."
→ The graph filters and returns all matching assets
→ Immediate insights for aligning with sustainability goals
🟢 "What would happen if we divested from all companies with poor environmental ratings?"
→ The LLM generates a multi-stage graph traversal
→ Execution nodes simulate rebalancing logic across the graph
→ The system returns impact analysis and potential reinvestment scenarios
All of this happens on-premise—LLM and graph engine included—keeping sensitive financial data secure within your infrastructure.
The Benefits: From Insights to Impact
This approach is more than a tech upgrade. It’s a transformation in how investment professionals interact with data:
Model Reality More Accurately
DOGs capture the actual structure of financial systems—not just simplified abstractionsDemocratise Access to Insight
Portfolio managers, analysts, even ESG officers can ask deep questions—without writing codeAccelerate Innovation
Add new asset types, sustainability metrics, or regulatory frameworks—without breaking your systemEmbed ESG into Core Workflows
No bolt-ons. ESG and financial logic live together inside the same graphStay Local and Secure
With everything running inside your firewall, compliance teams sleep easy
DOGs + AI: A New Era for Investment Analysis
This hybrid graph model enables a new style of thinking—one that reflects how investors and analysts actually reason about portfolios. Not linearly. Not in rows and columns. But as dynamic networks of interdependent elements that shift and recalculate as new data emerges.
And when combined with AI, these systems become not just queryable, but conversational.
We're moving from:
SQL queries → natural questions
Static dashboards → living models
One-size-fits-all analytics → personalised, context-aware insight
At Dataception, we call this talking to your portfolio—and it's changing how finance thinks about data.
With Dataception Ltd’s Data Object Graphs, AI-powered finance is just a walk in the park. 🐾